

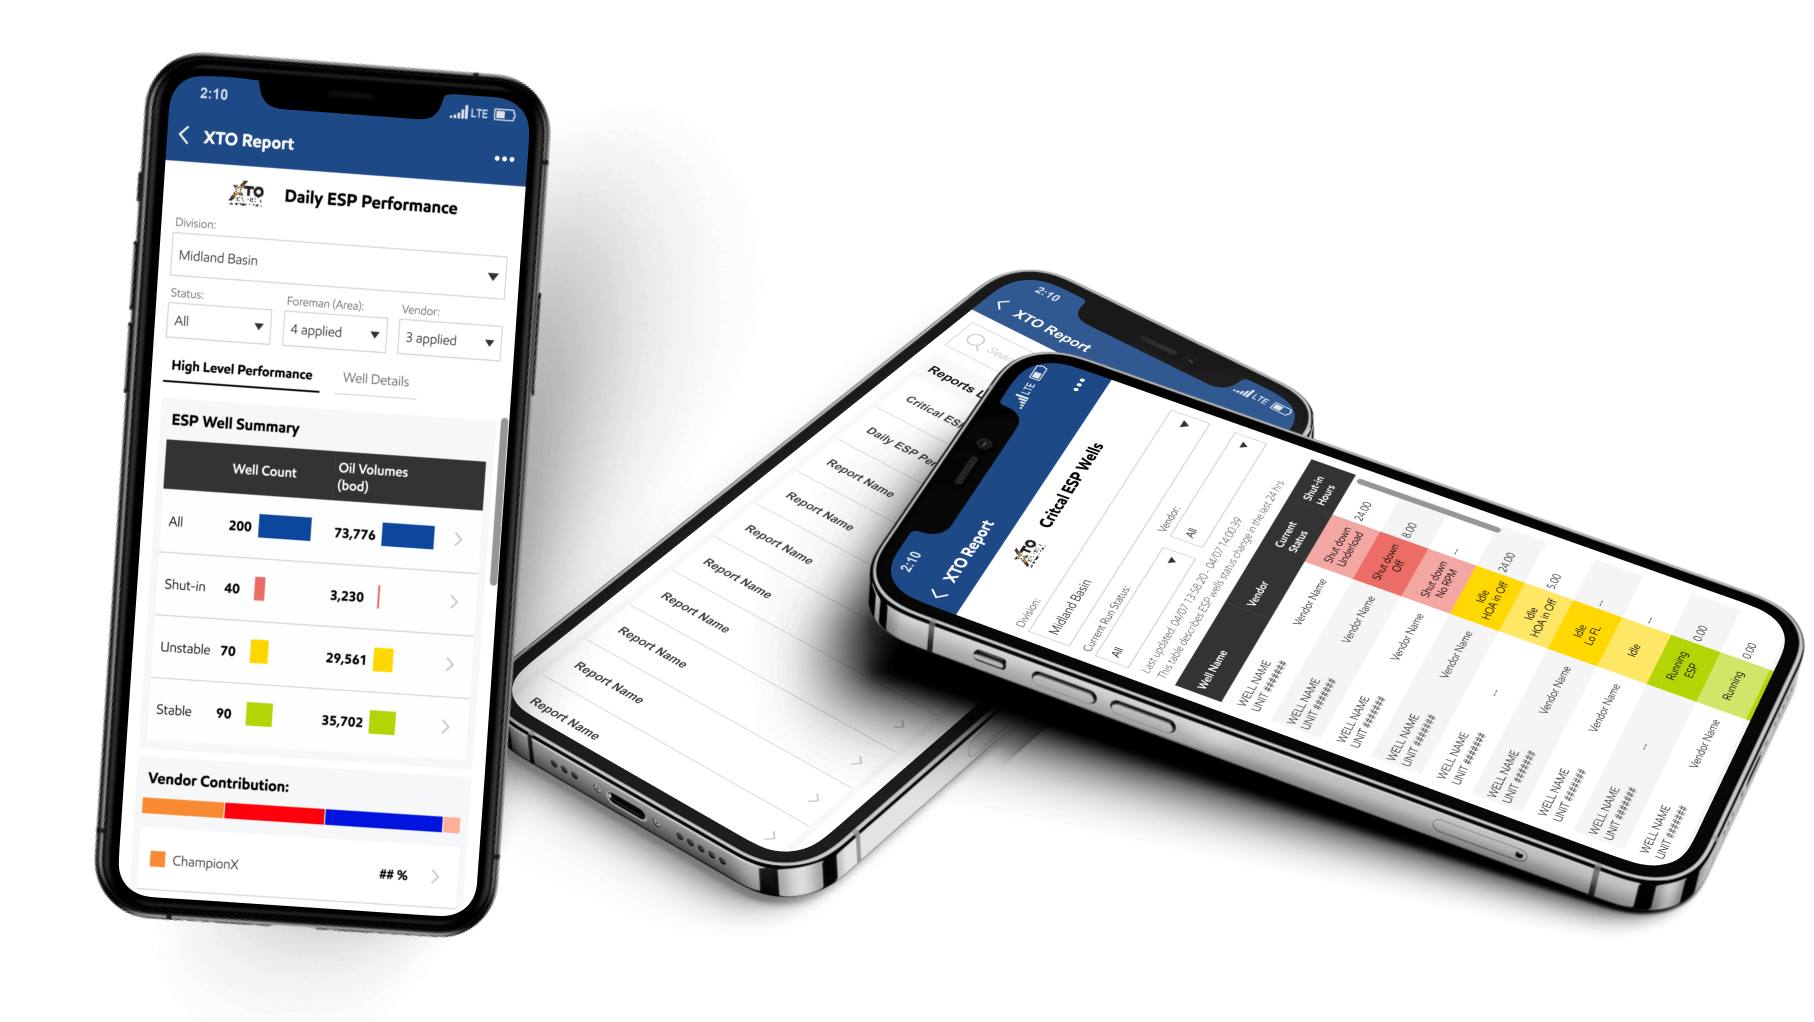
ESP Monitor
Visualized data in a mobile app to enhance accessibility and working efficiency.
My Contribution
Product Lead
Identified real user painpoints based on research and aligned with cross team to convey the solutions to detialed UI/UX design
UI/UX Designer
Delivered detailed design solutions that improved data consumption UX.
Team
3 App Engineers | 3 Deployment Engineers | 5 SMEs
Research Report | PRD | Hi-fi Mockups | Spreadsheet for Dev Schema
Impacts
Improved usability by 11.6% over industry average, reduced SNO (Suervailance & Optimization) budget by $85K/year, and enhanced cross-time-zone collaboration.

What & Why
Context
Carrying a laptop or printed hardcopies to inspect ESP wells is inconvenient for users, leading them to request a mobile version of the web tool they currently rely on.
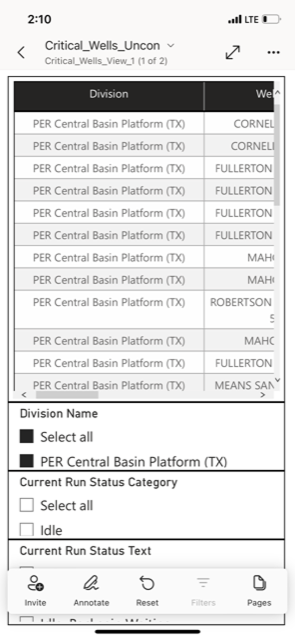
Current Mobile Report
Engineers developed the mobile report based on user requests, But fewer than 2% of users actively use the feature.

Identify Problems
The original mobile report was built without understanding real workflows, leading to less than 2% adoption.
To address this, I interviewed SMEs and key user representatives to uncover pain points across the full inspection process and identify solutions that truly align with their field workflows.
User Goals
- Identify problematic wells—remotely and on-site—based on data and physical well conditions, filtered by base, foreman, or vendor.
- Access detailed real-time data in time for unstable or shut-in wells to support troubleshooting.
Current User Workflow
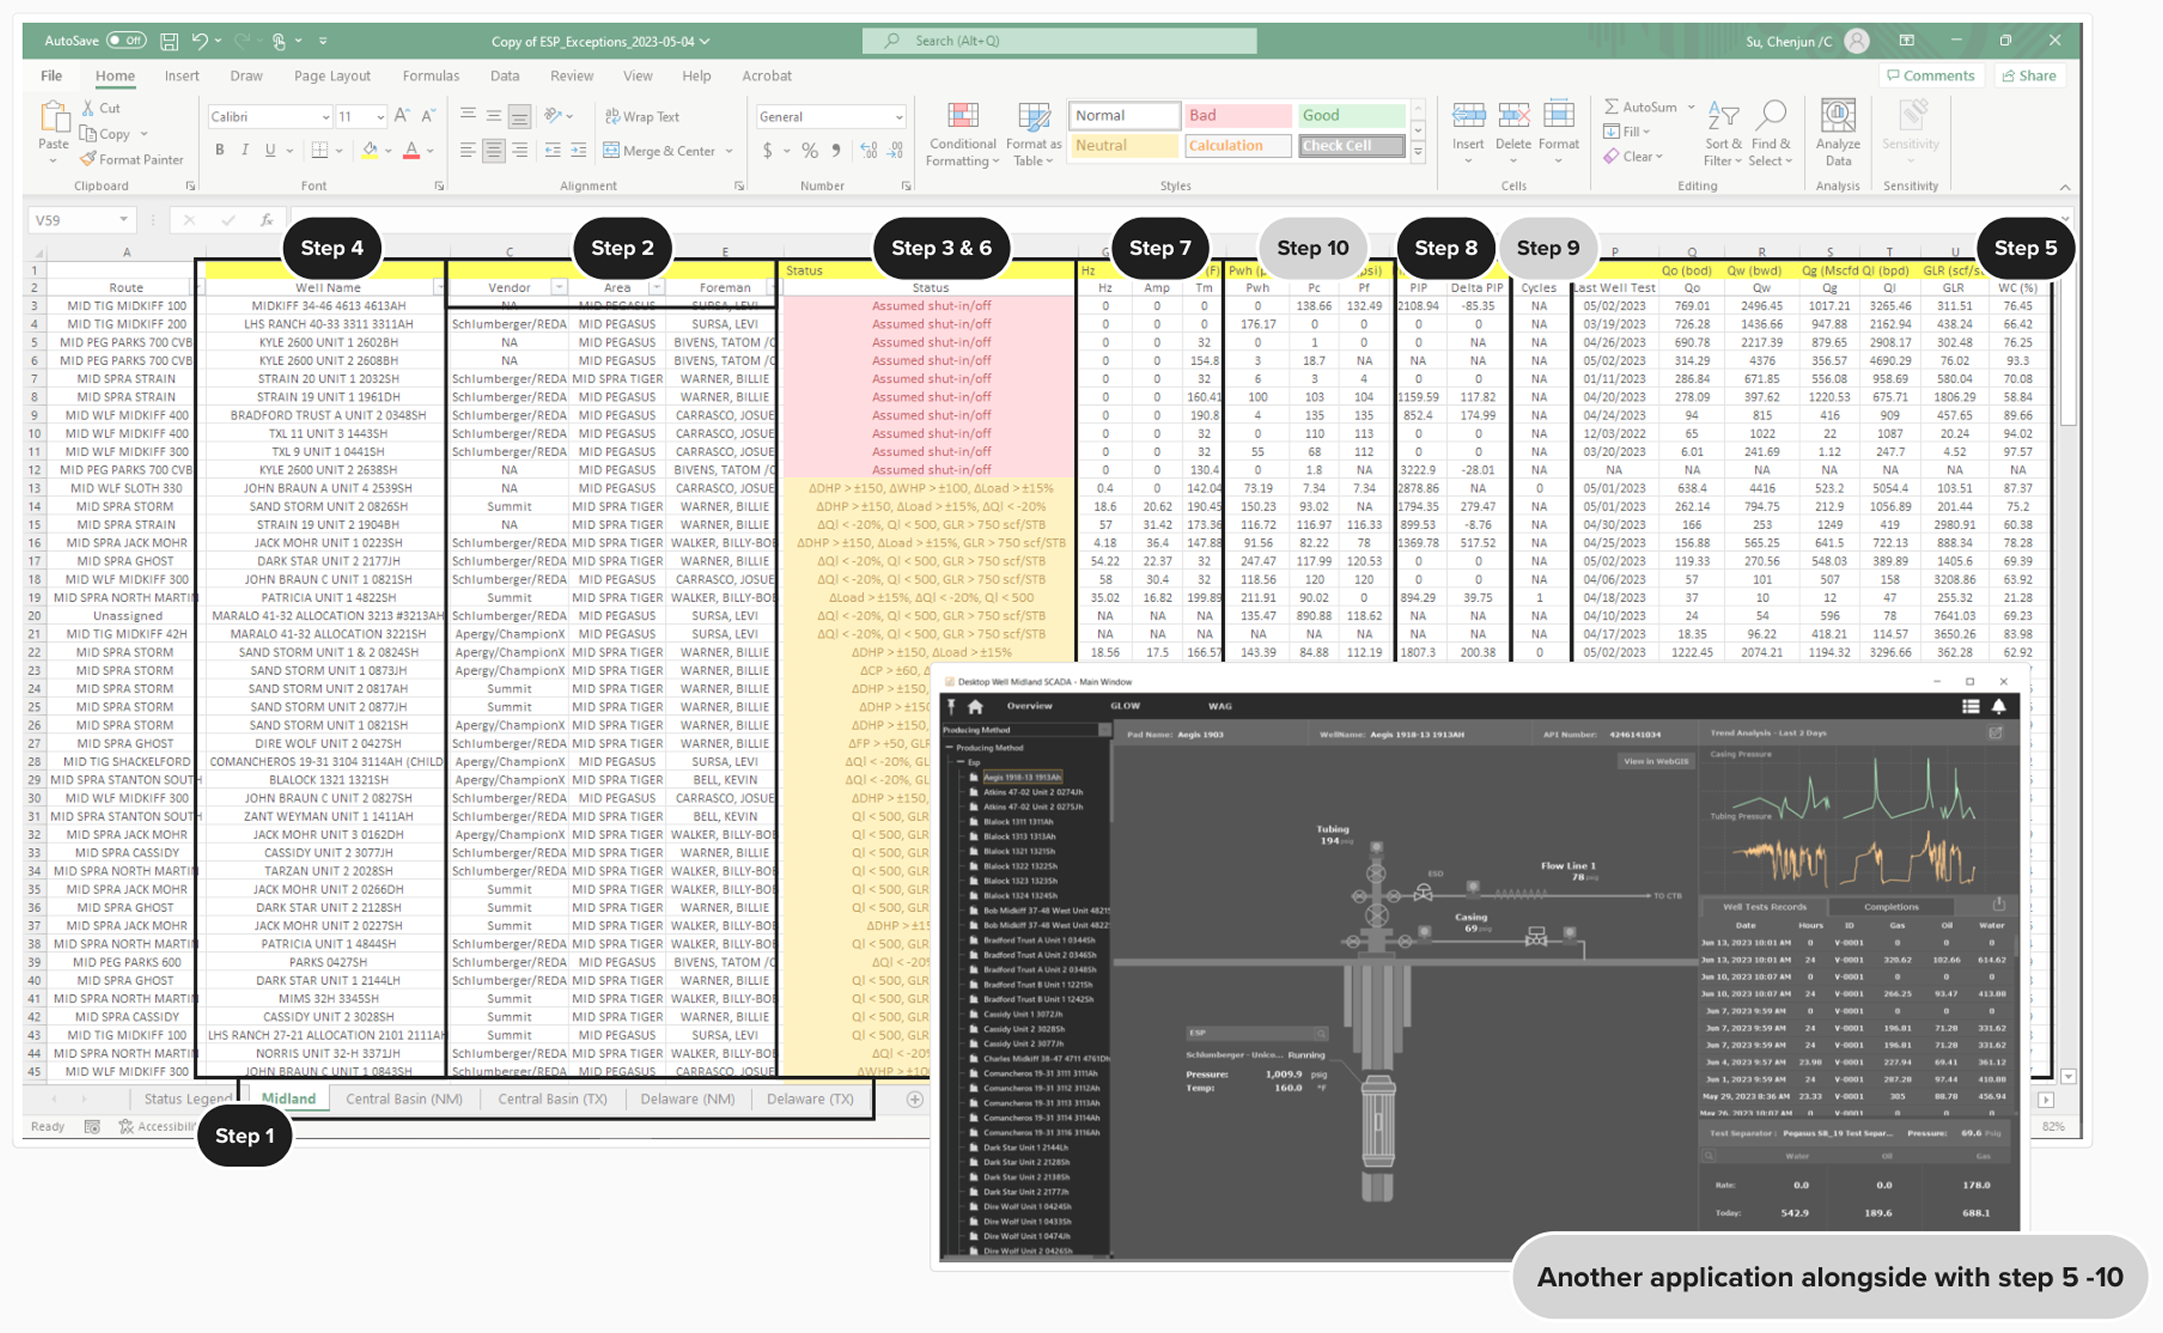
- During ESP well inspections in the field, users rely on spreadsheets to filter information.
- Separately open SCADA Ignition to access the relevant data to troubleshoot a specific well.
User Problems
- Poor Mobile Usability: The current mobile table is a direct copy of six large spreadsheets—each with 20+ columns—making it difficult to read
- No Issue Highlighting: Without access to ML model outputs, the dashboard can't distinguish between normal and problematic wells, forcing users to take manual notes during field inspections.
- Missing Real-Time Data: There’s no API to pull real-time SCADA data into the app, so users must return to their laptops and open SCADA Ignition to retrieve the information needed for troubleshooting.
Design Challenges
- Platform Selection: The current report is hosted in Power BI Mobile, but lacks a SCADA API connection for real-time data. Which platform is best suited to host this feature moving forward?
- Dashboard Clarity: How can we present a clear, use-case-driven overview dashboard that fits within the constraints of a mobile screen without overwhelming users?
- ML Data Consumption: How do we display and enable user-friendly interaction with machine learning data currently compiled in a spreadsheet with 20+ columns?
Cross Team Alignment - Which App
- Currently, 3 mobile apps are used in the field: Joyn, Power BI, and Field Hub.
- We chose Field Hub to host this feature because it doesn’t have API and scalability limits.
Information Architecture - Entry
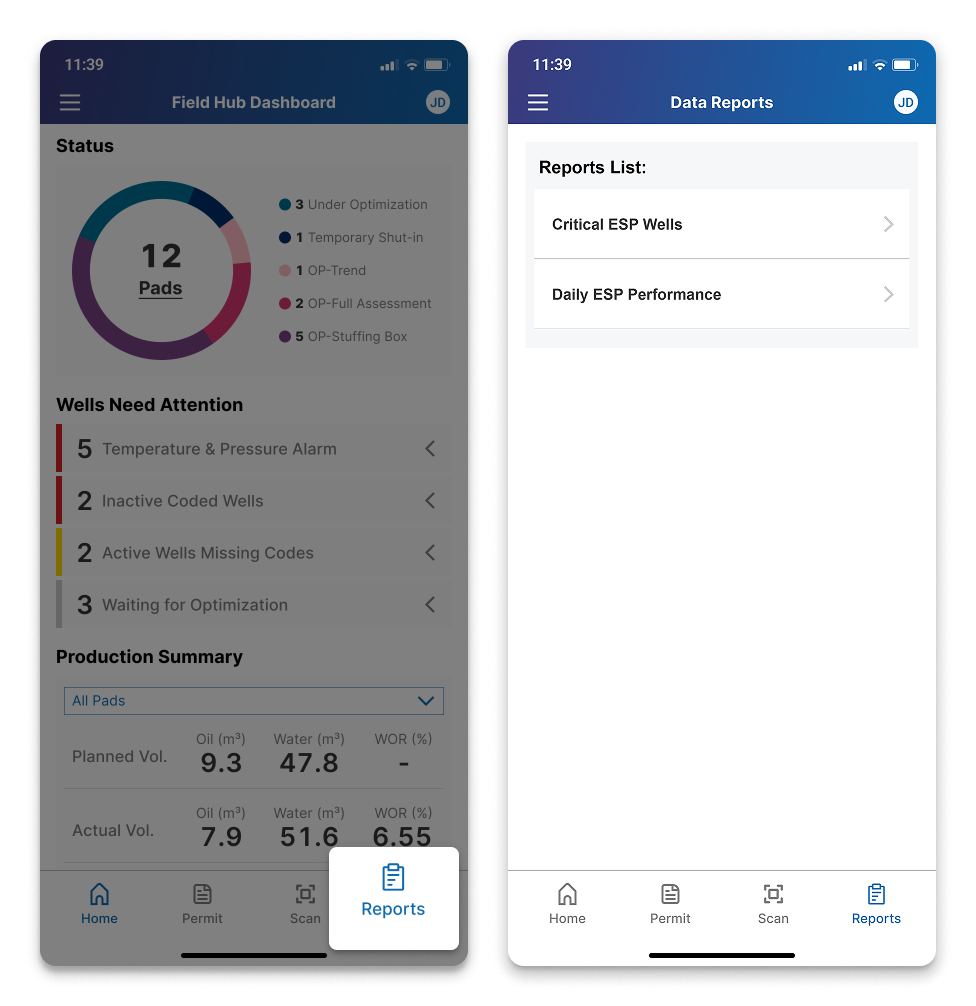
With the SCADA API as the core request for this feature, which enables 50+ dashboards as a core app feature, we introduced a new navigation tab to organize them, supporting current needs and future scalability.
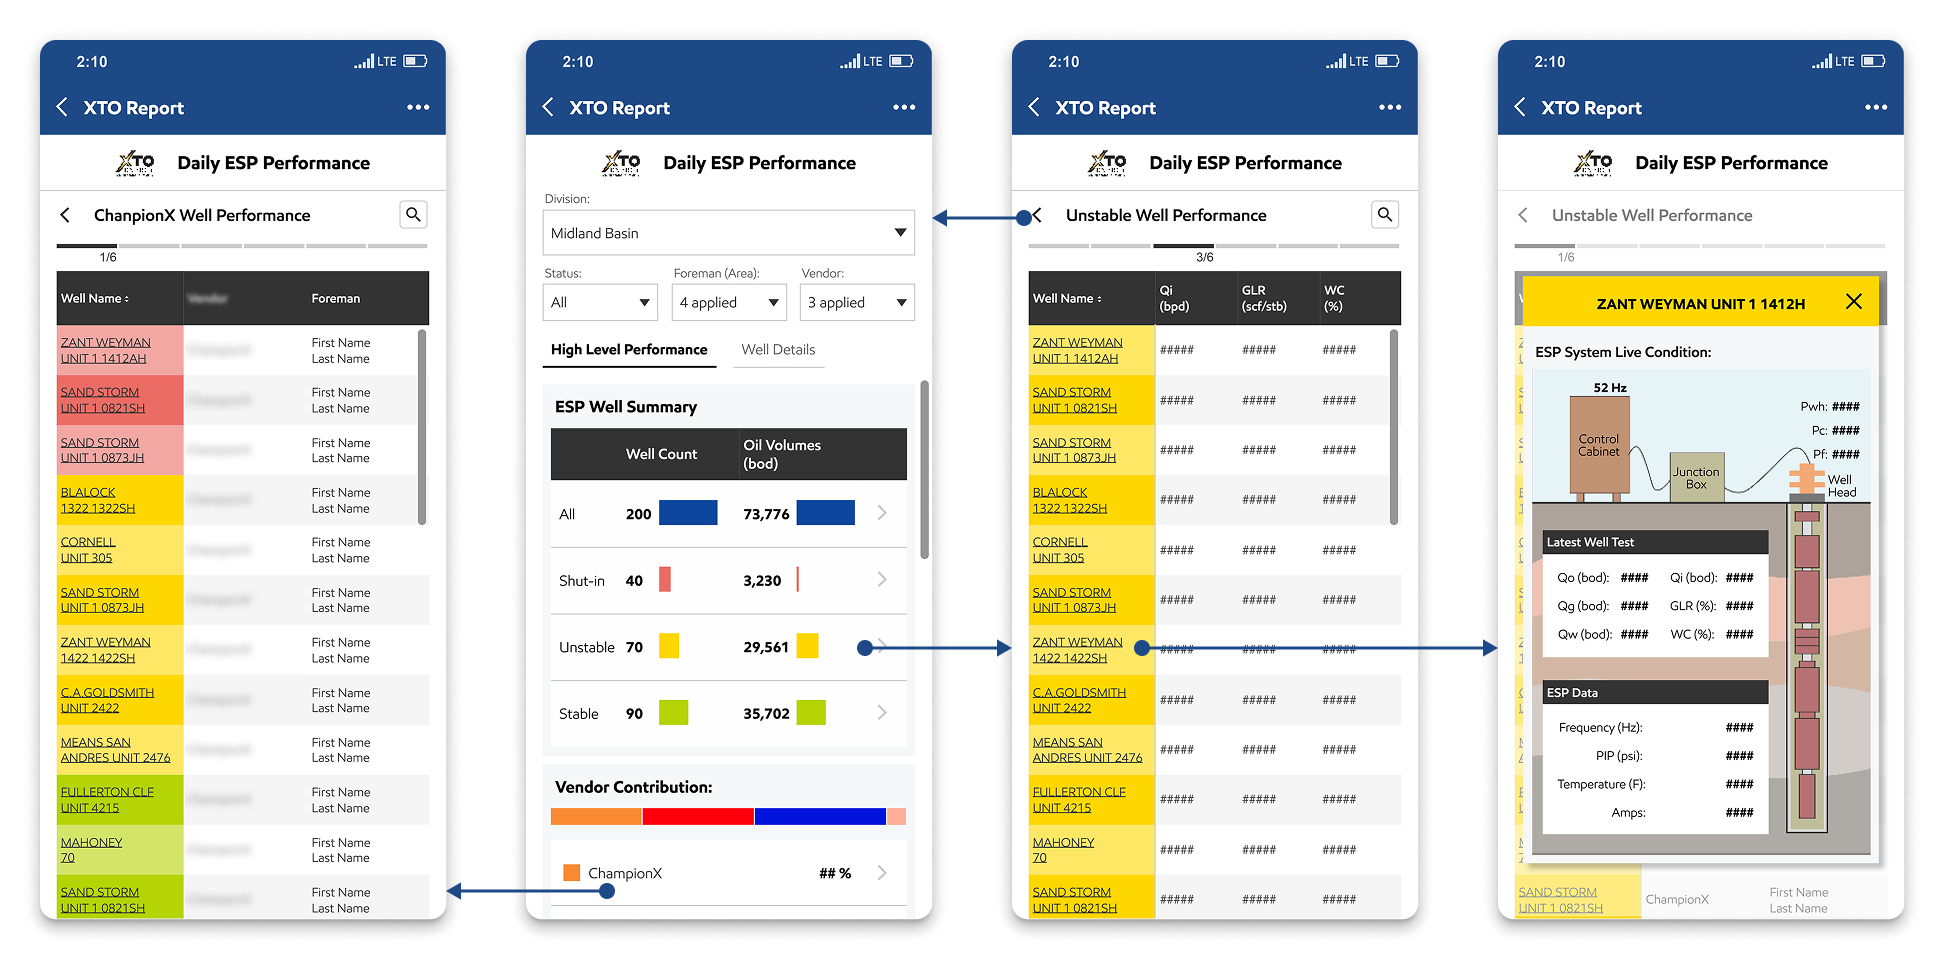
Design Solution: Integrated Dashboard with Drill-Down Capability
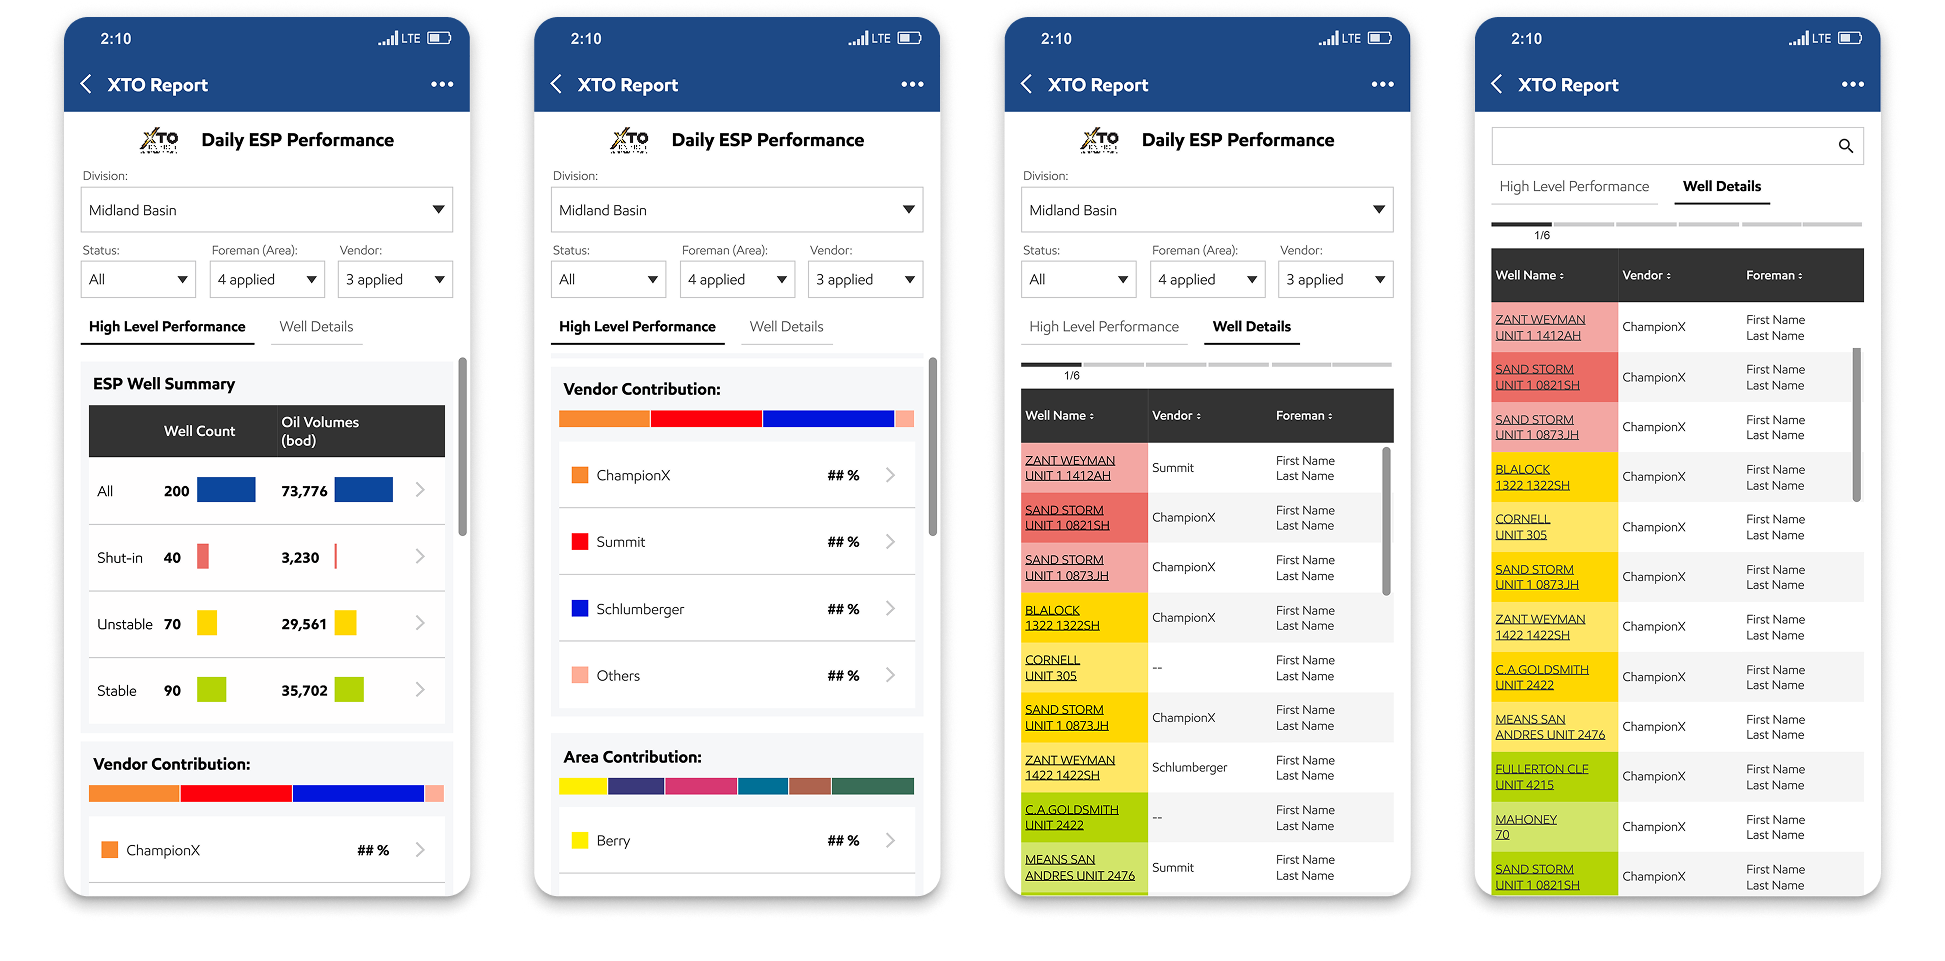
A clear overview dashboard with primary filters allows users to quickly access overall well performance data based on specific scenarios. A tab switch enables users to toggle between the dashboard view and a detailed view of individual wells for deeper insights.
Design Solution: Organized ML Insights and Live Data
Data is organized by usage and comparison needs for quicker access. Users can swipe to view different ML model results, and real-time data from SCADA during inspections for greater accuracy and efficiency.
Impacts
- Identified and addressed real user pain points, increasing active usage from 2% to 73%.
- Streamlined field inspections, saving each engineer 1.5 hours daily and boosting operational efficiency.
- Introduced a new real-time data API, enabling future automation of artificial lift operations and reducing surveillance costs.
Mobile Dashboard: ESP Monitor
Visualized Excel and ML data in a mobile app to enhance accessibility and working efficiency.
My Contribution
Product Lead

Identify Problems
Led research and cross-team alignment to turn pain points into actionable design scope.
UI/UX Designer
Design
Delivered detailed design solutions that improved data consumption UX.
Team
1 Designer (me) | 1 Developer | 1 SME | 10+ User Representatives
Impacts
Impacts
Raised active usage to 73%, saved 1.5 hours per user daily, and enabled future automation

What & Why
Context
Carrying a laptop to inspect ESP wells is inconvenient for operators and field engineers, so the users requested a mobile version of the web data report they currently rely on.
Current Mobile Report
Engineers developed the mobile report based on user requests, But fewer than 2% of users actively use the feature.
Identify Problems

Back
The original mobile report was built without understanding real workflows, leading to less than 2% adoption.
To address this, I interviewed SMEs and key user representatives to uncover pain points across the full inspection process and identify solutions that truly align with their field workflows.
User Goals
- Identify problematic wells—remotely and on-site—based on data and physical well conditions, filtered by base, foreman, or vendor.
- Access detailed real-time data in time for unstable or shut-in wells to support troubleshooting.
Current User Workflow
- During ESP well inspections in the field, users rely on spreadsheets to filter information.
- Separately open SCADA Ignition to access the relevant data to troubleshoot a specific well.
User Problems
- Poor Mobile Usability: The current mobile table is a direct copy of six large spreadsheets—each with 20+ columns—making it difficult to read
- No Issue Highlighting: Without access to ML model outputs, the dashboard can't distinguish between normal and problematic wells, forcing users to take manual notes during field inspections.
- Missing Real-Time Data: There’s no API to pull real-time SCADA data into the app, so users must return to their laptops and open SCADA Ignition to retrieve the information needed for troubleshooting.

Design Challenges
Back
- Platform Selection: The current report is hosted in Power BI Mobile, but lacks a SCADA API connection for real-time data. Which platform is best suited to host this feature moving forward?
- Dashboard Clarity: How can we present a clear, use-case-driven overview dashboard that fits within the constraints of a mobile screen without overwhelming users?
- ML Data Consumption: How do we display and enable user-friendly interaction with machine learning data currently compiled in a spreadsheet with 20+ columns?
Cross Team Alignment - Which App
- Currently, 3 mobile apps are used in the field: Joyn, Power BI, and Field Hub.
- We chose Field Hub to host this feature because it doesn’t have API and scalability limits.
Information Architecture - Entry
With the SCADA API as the core request for this feature, which enables 50+ dashboards as a core app feature, we introduced a new navigation tab to organize them, supporting current needs and future scalability.
Design Solution: Integrated Dashboard with Drill-Down Capability
A clear overview dashboard with primary filters allows users to quickly access overall well performance data based on specific scenarios. A tab switch enables users to toggle between the dashboard view and a detailed view of individual wells for deeper insights.
Design Solution: Organized ML Insights and Live Data
Data is organized by usage and comparison needs for quicker access. Users can swipe to view different ML model results, and real-time data from SCADA during inspections for greater accuracy and efficiency.

Impacts
Back to top
- Identified and addressed real user pain points, increasing active usage from 2% to 73%.
- Streamlined field inspections, saving each engineer 1.5 hours daily and boosting operational efficiency.
- Introduced a new real-time data API, enabling future automation of artificial lift operations and reducing surveillance costs.

Fault Clear
All Projects
